Federal Reserve policy 2026 expectations: Market Outlook
The year 2026 sits at a pivotal junction for financial markets as investors and corporate planners weigh the Federal Reserve’s policy 2026 expectations against a backdrop of cooling inflation, a resilient labor market, and evolving technology-driven growth. For readers at Wall Street Economicists, this trend analysis focuses on how the Fed’s latest projections shape asset prices, financing costs, and strategic business decisions. The central question: will the Fed sustain a cautious pause, or begin a measured easing cycle in 2026 that could bend the curve on equity valuations, debt yields, and consumer credit? The December 2025 Summary of Economic Projections (SEP) provides a concrete baseline, showing a modestly higher growth path and a path for rate reductions that remains data dependent. In the coming sections, we’ll translate those official numbers into market implications and actionable takeaways for technology-driven firms and market participants. This piece centers on the keyword Federal Reserve policy 2026 expectations and grounds its narrative in the latest available data and expert analysis. (federalreserve.gov)
Section 1: What’s happening now
Policy Path in the SEP
The Federal Reserve’s December 2025 SEP presents a central scenario in which the funds rate ends 2026 a touch lower than end-2025, signaling a measured easing path rather than a rapid retreat. The memo “Projected appropriate policy path” shows the end-of-year federal funds rate at about 3.4% for 2026, with a further movement toward 3.1% by 2027 and 3.0% in the longer run. In other words, the Fed’s own baseline envisions a modest tightening-to-easing drift over the 2025–2027 window, rather than a rapid drop to pre-pandemic norms. This is a critical data point for investors who price risk, liquidity, and earnings assumptions around interest costs. (federalreserve.gov)
From the same December 2025 projection, real GDP growth for 2026 sits around 2.3%, with the unemployment rate near 4.4% and headline PCE inflation about 2.4% for 2026. Core PCE inflation is projected around 2.5% for 2026. Taken together, these metrics imply a still-rapidly evolving inflation picture but one that is trending toward the Fed’s target with gradual accommodation as inflation decelerates. For market participants, the combination of a sub-4% unemployment rate and still-elevated inflation pressures helps explain why the policy path remains data-dependent and not aggressively expansionary. (federalreserve.gov)
The Fed’s 2025–2026 projections, including the end-2026 rate and the 2026 growth/inflation mix, are reinforced by broader research from major regional institutions. The New York Fed’s DSGE model, for example, emphasizes how forecasts for r* and the stance of policy have evolved while the model’s central tendencies still reflect a gradual adjustment rather than a hard pivot. While the New York Fed model is a forecasting tool rather than a policy pronouncement, it provides a useful cross-check to market-based expectations about the pace and magnitude of policy normalization. (libertystreeteconomics.newyorkfed.org)
What this means for markets today is a landscape in which financial conditions remain tighter than in the late-2010s but gradually loosen as inflation cools and the labor market stabilizes. The 2026 outlook is not a simpler story of cuts; it’s a nuanced shift in the rate path, with investors watching inflation signals, wage dynamics, and global growth to determine when—and how much—the Fed will ease. A few headline numbers help anchor the discussion: end-2026 funds rate around 3.4% (Fed baseline), 2026 GDP near 2.3%, unemployment around 4.4%, and 2026 PCE inflation at roughly 2.4% with core PCE at about 2.5%. These figures come from the December 2025 SEP and subsequent interpretations from major research outlets. (federalreserve.gov)
Case examples: real-world implications (2 perspectives) Case Study 1: U.S. housing market in a data-driven rate environment
- January 2026 existing-home sales dropped 8.4% year over year to a seasonally adjusted annual rate of 3.91 million, according to the National Association of Realtors. The decline occurred even as mortgage rates showed modest cooling, illustrating that affordability, inventory constraints, and weather can dominate demand at a given rate environment. This is a meaningful data point for how Federal Reserve policy 2026 expectations can influence consumer decisions in real time. (apnews.com)
- Mortgage rate movements continued to track broader financial conditions rather than the federal funds rate in a mechanical way. Freddie Mac data around early 2026 highlighted that the 30-year fixed rate hovered around the 6% area, a level that remains a meaningful affordability hurdle for many buyers even as the rate environment softens modestly from the highs of 2025. The housing market’s response—tight inventory, slower turnover, and price growth deceleration—offers a tangible read on how the Fed’s policy trajectory translates into real economic activity. These dynamics have implications for banks, mortgage originators, and homebuilders, all of which must plan around evolving demand and refinancing incentives. (apnews.com)
Case Study 2: Corporate financing and equity market implications under 2026 rate-path expectations
- Private-sector forecasts and market commentary in late 2025 and early 2026 suggested that a slower pace of rate cuts could support a steadier, more predictable debt-market environment. Goldman Sachs Research, in particular, projected a pause in January 2026 followed by rate cuts in March and June, bringing the terminal funds rate down to about 3–3.25%. This framing matters for corporate financing decisions, including bond issuance timing, refinancing activity, and equity risk pricing as investment cash flows hinge on discount rates that reflect the prevailing policy stance. The firm’s February 2026–timing thoughts emphasize that even with easing in 2026, inflation dynamics and labor market strength will shape how quickly financing conditions improve. For a concrete view of that guidance, see Goldman’s Dec 3, 2025 update. (goldmansachs.com)
- The Fed’s own end-2026 rate path, if realized, would align with a more gradual easing cycle rather than a rapid tightening unwind. A slower normalization can influence equity valuations, risk premia, and corporate profitability forecasts, as discount rates compress gradually rather than in a sudden shift. The essential takeaway from these case studies is that the policy path in 2026 will feed through the cost of capital for technology-driven firms and high-growth companies, with capital markets responding to both inflation trajectories and the rate trajectory. (federalreserve.gov)
Section 2: Why this is happening
Macro dynamics driving Fed policy 2026 expectations
- Inflation has shown persistent moderation, but the composition of that inflation matters. Headline PCE inflation in the SEP pathway sits around 2.4% for 2026, with core PCE near 2.5%. The message is that inflation pressures have shifted toward services and shelter in some cycles, while goods disinflation has continued. This nuanced inflation path supports a policy stance that is neither aggressively tight nor aggressively loose, but remains data dependent as the Fed seeks to anchor inflation near target. (federalreserve.gov)

- The labor market remains a crucial constraint on policy normalization. The SEP implies an unemployment rate around 4.4% in 2026, a level that is still consistent with a healthy but not overheating labor market. The economy’s ability to add or shed jobs, wage dynamics, and labor-force participation will continue to shape how quickly the Fed pivots from restraint to accommodation. The December 2025 SEP explicitly anchors unemployment around this range for 2026. (federalreserve.gov)
Tech and market drivers shaping the 2026 outlook
- A major structural driver behind Fed policy 2026 expectations is the evolution of technology-enabled productivity and its potential to alter the natural rate of interest (r*). The New York Fed’s DSGE model analysis (December 2025) emphasizes how forecasts for r* and the stance of policy have evolved in the last year, suggesting that the path of policy could be shallower than in earlier cycles if productivity gains prove durable and inflation dynamics stay under control. While the model is a forecasting tool rather than a policy directive, it reinforces that the Fed’s perceived “neutral” rate and the appropriate policy path depend on evolving technology-driven growth. (libertystreeteconomics.newyorkfed.org)
- Private-sector research from major banks has highlighted a hedging-like attitude toward rate decisions given the uncertain inflation trajectory and labor market momentum. Goldman Sachs, in its December 2025 outlook, frames the 2026 path as contingent on inflation cooling and growth reaccelerating, with a multi-step easing path that begins with a pause and then measured cuts. That calculus—anchored by a softer inflation profile and manufacturing/digital economy dynamics—helps explain why equity and fixed-income markets are pricing in a gradual improvement rather than an abrupt pivot. (goldmansachs.com)
Industry factors shaping the 2026 trajectory
- The technology sector’s investment cycle—especially in AI, cloud infrastructure, and semiconductors—intersects directly with the Fed’s policy path. If disinflation persists and productivity gains materialize, capex could accelerate, reinforcing a more favorable financing environment even with higher initial rates. Conversely, if inflation proves stickier than expected or if labor markets tighten, the Fed could delay easing, maintaining tighter financial conditions for longer. Goldman’s 2026 outlook explicitly links these macro and sectoral dynamics to a measured easing path, illustrating how tech-driven growth can interact with monetary policy in the near-term horizon. (goldmansachs.com)

Section 3: What it means
Business impact: financing, strategy, and margins
- A rate path that moves gradually lower in 2026 could improve corporate borrowing costs modestly over the course of the year, supporting refinancings, share buyback programs, and capex plans for technology-heavy firms. The December 2025 SEP’s end-2026 rate projection of 3.4% aligns with a market environment where the cost of debt drifts down slowly, enabling companies to edge down financing costs without sacrificing investment discipline. The market’s reaction in late 2025 and early 2026 has been to price in a slower but steady normalization of rates, which is favorable for long-duration corporate issuances and equity risk-taking, albeit with caution around inflation and growth surprises. (federalreserve.gov)
- For technology platforms and AI-enabled enterprises, a cautious but constructive rate path could support higher capex intensity and acceleration of digital transformation programs, but only if the macro backdrop remains supportive. As the 2026 path suggests a non-negligible but controlled easing, CIOs and CFOs should plan capital budgets around modestly improving financing costs while maintaining resilience against potential inflation shocks or supply-chain disruptions. The case studies above illustrate how real-world sectors—housing and corporate finance—respond to the same Federal Reserve policy 2026 expectations in different ways. (apnews.com)
Consumer effects: credit, housing, and sentiment
- Consumers are impacted by mortgage rates, credit conditions, and wage growth. Although mortgage rates eased modestly in late 2025, January 2026 data show that affordability remains a significant hurdle for many buyers, contributing to slower turnover in housing markets even as rates pull back from earlier peaks. A more gradual Fed easing path could further ease mortgage rates later in 2026, potentially helping housing demand recover gradually if home affordability improves and supply remains constrained. For context, the AP’s January 2026 housing data show the ongoing relationship between rates, inventory, and demand, while Freddie Mac’s rate snapshots in early 2026 reflect continued sensitivity to rate movements. (apnews.com)

- The consumer credit environment could respond positively to a more predictable rate path, with lower discount rates supporting consumer spending and investment. However, a meaningful U.S. slowdown or persistent inflation could delay the benefits of easing for households, especially those with variable-rate debt. The Fed’s own projections emphasize that the policy path remains contingent on inflation and labor-market signals, underscoring the importance of ongoing data monitoring for consumer finance trends. (federalreserve.gov)
Industry changes: digital finance, banks, and risk management
- Banks and fintechs will need to adjust risk models to a economy where the policy path is gradual and inflation pressures are monitored closely. The New York Fed’s model and private-sector analyses point to a scenario in which risk premia and credit spreads could compress gradually as policy normalization proceeds, but only if growth and inflation stay on a stable track. Financial institutions can prepare by updating stress tests, reevaluating liquidity buffers, and sharpening hedging strategies around duration risk and credit risk. The synthesis of official projections and market consensus in late 2025–early 2026 suggests a favorable but cautious environment for balance-sheet management and investment in digital-scale fintech platforms. (libertystreeteconomics.newyorkfed.org)
Section 4: Looking ahead
6–12 month macro outlook
- Within the next 6–12 months, the market consensus around Federal Reserve policy 2026 expectations points toward a measured easing cycle beginning in 2026, with the pace and timing highly data dependent. Goldman Sachs’ updated view in December 2025 and early 2026 calls for a pause in January 2026, then cuts in March and June, moving toward a terminal rate of 3–3.25% by mid-2026; this framework suggests a more favorable but not aggressively easing monetary environment for risk assets and technology-led growth. Investors should watch inflation progress, wage dynamics, and the health of consumer demand as the primary drivers of the rate path. (goldmansachs.com)
- The official path from the Dec 2025 SEP provides a more modest easing path than some market optimists anticipated. End-2026 funds rate projected at 3.4% implies a partial reduction from end-2025 levels, which could translate into a mild uplift in equity multiples as the discount rate pressure eases. Meanwhile, 2026 GDP around 2.3% and unemployment near 4.4% work in tandem with inflation trends to shape investor risk appetites. Market participants should prepare for continued volatility as inflation data, geopolitical developments, and domestic policy signals interact with the Fed’s communications. (federalreserve.gov)
Opportunities and strategic considerations
- For technology-forward companies, the opportunity lies in aligning capital planning with a data-driven approach to the rate path. If inflation cools toward target and the Fed maintains a patient stance, opportunities include:
- Refinancing existing debt at gradually lower costs.
- Accelerating AI and cloud infrastructure investments that enable higher productivity and margin expansion over the medium term.
- Exploiting improved market visibility for longer-term strategic partnerships and product development cycles.
- For investors and lenders, the path suggests:
- A gradual re-pricing of risk as discount rates move lower but remain anchored by inflation and growth concerns.
- Increased attention to duration risk and liquidity management, given the potential for shifting rate expectations as the year unfolds.
- A focus on sectors with high sensitivity to interest rates (real estate, financials, technology) to capture the transition dynamics without overconcentrating in any one bet.
Table: A quick comparison of Fed end-2026 expectations vs market views (selected metrics) | Metric | Fed Dec 2025 SEP End-2026 | Goldman Sachs 2026 Outlook (market view) | | Federal funds rate (end-2026) | 3.4% | Terminal 3–3.25% after pauses and cuts in 2026 (pause Jan, cuts in Mar and Jun) (federalreserve.gov) | | Real GDP growth (2026) | 2.3% | 2.0–2.5% as growth reaccelerates and inflation cools (federalreserve.gov) | | Unemployment rate (2026) | 4.4% | About 4.4% (modestly above) per the Goldman forecast narrative (federalreserve.gov) |
Notes:
- The table’s Fed end-2026 figure is pulled from the December 2025 SEP (the memo’s “Projected appropriate policy path” for 2026 end). The Goldman figure reflects the December 2025 Goldman Sachs Research outlook (pause after January, then cuts in March and June, with a terminal rate around 3–3.25%). (federalreserve.gov)
- GDP and unemployment numbers are the central tendencies from the SEP, while the Goldman numbers reflect their forecast range and emphasis on the rate-cut timing. See the source material for the exact framing and ranges. (federalreserve.gov)
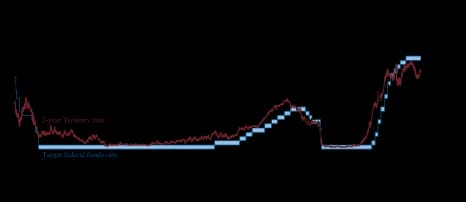
For readers who want a deeper dive, the federal funds rate projections and the associated ranges around the central tendency are depicted in the official SEP figures and accompanying fan charts in the Fed’s projection materials. The fan charts illustrate how individual participants’ judgments about the end-of-year rate outcomes vary, and how those distributions evolve with new data. The December 2025 projections show a narrower dispersion than in years past, but the range around the end-2026 projection still reflects meaningful uncertainty in the path of monetary policy. (federalreserve.gov)
Closing thoughts Federal Reserve policy 2026 expectations point to a world where financial conditions gradually ease if inflation remains on a downward trajectory and the labor market remains resilient, but the path is not guaranteed. The Fed’s own December 2025 SEP signals a measured, data-dependent approach rather than a dramatic pivot, with end-2026 rate projections around 3.4% and GDP growth in the 2.0–2.5% neighborhood. Market consensus, as captured by Goldman Sachs’ outlook, adds a flavor of modest-paced easing—pausing early in the year and then delivering cuts in the middle of 2026—creating a nuanced tension between slower inflation and the risk of renewed price pressures from tariffs, supply chains, or external shocks. For readers focused on technology and market trends, this environment creates both challenges and opportunities: a more predictable cost of capital can bolster AI-driven capex plans, while ongoing inflation risks and wage dynamics require disciplined execution and robust risk management.
If you’re building investment or financing plans for 2026, prioritize data-driven scenario analysis that can adapt to both a softer inflation regime and a slower pace of easing. Track the evolving SEP communications, monitor the inflation trajectory, and maintain flexibility in capital structure decisions to respond to shifts in the rate path as new data arrives. The Fed’s policy 2026 expectations are a moving target, but with careful reading of the latest projections and market signals, you can position technology and finance strategies to navigate a data-driven, gradual easing regime.