Inflation data February 2026: CPI Trends & Implications
The Inflation data February 2026 landscape is unfolding with January’s CPI prints now in the books and February’s numbers on the horizon. For readers of Wall Street Economicists, the focus remains squarely on how price movements interact with monetary policy, corporate pricing power, and consumer affordability. The January CPI data released on February 13, 2026 show a modest, broad-based cooling in inflation, a shift that keeps the Federal Reserve’s policy narrative under close scrutiny as markets price in potential rate paths. As we turn toward Inflation data February 2026, the central question is whether February’s data will confirm this cooling pattern or reveal new pockets of stickiness. This data round-up synthesizes the latest Bureau of Labor Statistics (BLS) statistics, cross-checks with alternative nowcasting from the Cleveland Fed, and early market interpretations from major outlets, all with an eye toward technology-driven market implications and macro risk signals. The most surprising stat in the current set is not a single number but the compelling contrast between a still-elevated, shelter-driven inflation profile and a broad-based slowdown in headline inflation, underscoring how the composition of price changes matters for policy and markets. The data and interpretations below rely on current releases and official data series to keep analysis precise and auditable. Sources include the BLS CPI release for January 2026, the Cleveland Fed inflation nowcasting series, and related macro data publications. For context beyond the United States, European inflation signals are also noted where relevant to illustrate the global price-setting environment that can influence domestic expectations. Sources are cited after each statistic so readers can verify numbers and methodology.
The January CPI data released on February 13, 2026, show the U.S. consumer price index rising 0.2% month over month and 2.4% over the prior 12 months, while core inflation rose 0.3% month over month and 2.5% year over year. The next CPI release for February 2026 is scheduled for March 11, 2026, at 8:30 a.m. ET. (bls.gov)
Opening note: Inflation data February 2026 will be read through several lenses—headline CPI, core CPI, shelter and housing components, energy and gasoline price dynamics, food pricing, and labor-market context—to determine whether the Fed’s policy stance remains on hold or shifts toward a gradual path of tighter or looser policy. The January numbers give us a baseline for what to expect in February, particularly as market participants calibrate rate expectations against the evolving inflation mix. As you review the statistics below, you’ll see the theme of broad moderating inflation tempered by pockets of resilience in services and housing, a pattern that has important implications for technology-enabled pricing and growth strategies across sectors. The data below are anchored in the official BLS CPI release and corroborating sources, with cross-checks from nowcasting models and reputable financial outlets for broader interpretation.
Section 1: Themed Statistics
Headline Inflation Dynamics
All items monthly CPI change (January 2026)
-
Stat: +0.20% month over month (seasonally adjusted) Context: This marks a modest monthly increase, consistent with a cooling trend from prior months. What it means: A small monthly gain keeps inflation from accelerating but signals ongoing price pressures in aggregate, which can influence near-term rate expectations. Source: U.S. Bureau of Labor Statistics CPI News Release, January 2026. (bls.gov)
-
Stat: 12-month CPI change (January 2026): +2.4% Context: The annual inflation rate is down from earlier peaks and near the bottom of the 2–3% range observed over much of the past two years. What it means: A 2.4% annual inflation rate provides room for market participants to price in a potential rate path closer to neutral, though real-time policy signals will hinge on core dynamics. Source: BLS CPI News Release, January 2026. (bls.gov)
-
Stat: Core CPI monthly change (January 2026): +0.30% Context: Core inflation excludes food and energy and rose at a firmer pace than headline CPI in January. What it means: Persistence in core inflation around the 0.3% monthly pace can keep pressure on the Fed to maintain a cautious stance on policy tightening or rate cuts, especially if services inflation remains resilient. Source: BLS CPI News Release, January 2026. (bls.gov)
-
Stat: Core CPI 12-month change (January 2026): +2.5% Context: The year-over-year rate remains above the Fed’s 2% target but closer to pre-pandemic norms in the context of a still-tight services sector. What it means: The core rate suggests underlying inflation remains anchored in services and shelter, which has implications for pricing power in technology-enabled services and enterprise software where services components are prominent. Source: BLS CPI News Release, January 2026. (bls.gov)
Housing and Shelter Dynamics
Shelter, monthly price movements

-
Stat: Shelter index monthly change (January 2026): +0.20% Context: Shelter remains the largest single contributor to the month’s CPI uptick. What it means: Housing costs continue to be a central driver of inflation, with ripple effects on rent negotiations, mortgage pricing, and consumer budgets, especially for households reliant on housing services. Source: BLS CPI News Release, January 2026. (bls.gov)
-
Stat: Rent of primary residence 12-month change (January 2026): +2.8% Context: Rent continues to show a steady but slower pace of growth relative to the housing cycle peak. What it means: Rent inflation influences consumer budgets and services in the broader inflation mix; slower rent growth could ease service inflation pressures over time. Source: BLS CPI News Release, January 2026. (bls.gov)
-
Stat: Owners' equivalent rent 12-month change (January 2026): +3.3% Context: OER remains a key component of shelter in the CPI, sustaining a higher rate than overall inflation. What it means: Strong OER readings imply ongoing housing-market frictions and potential stickiness in housing-related services and rent dynamics, affecting consumer disposable income and corporate pricing decisions. Source: BLS CPI News Release, January 2026. (bls.gov)
-
Stat: Shelter 12-month inflation rate (January 2026): +3.0% Context: The shelter component sits at roughly 3% year over year, underscoring its role as a durable inflation pillar. What it means: Shelter’s persistent strength complicates the inflation narrative and can slow the pace at which headline inflation falls, potentially influencing the timing of rate adjustments. Source: BLS CPI News Release, January 2026. (bls.gov)
Food and Beverages
Overall food price movements
-
Stat: Food index monthly change (January 2026): +0.20% Context: Food prices rose moderately in the month, contributing to headline inflation. What it means: Food price dynamics, including shifts in grocery costs and dining, influence consumer spending and can affect household discretionary activity, including technology purchases and services. Source: BLS CPI News Release, January 2026. (bls.gov)
-
Stat: Food at home monthly change (January 2026): +0.20% Context: At-home food prices rose in January, echoing ongoing supply-chain and input-cost dynamics. What it means: At-home food costs affect the consumer price basket and, by extension, concerns about food affordability among households with tighter budgets. Source: BLS CPI News Release, January 2026. (bls.gov)
-
Stat: Food away from home monthly change (January 2026): +0.10% Context: Food-away-from-home inflation ticked up modestly. What it means: Dining-out and takeout pricing contribute to consumer inflation without being fully offset by other goods, affecting consumer choices on discretionary spending including technology services. Source: BLS CPI News Release, January 2026. (bls.gov)
-
Stat: Food index 12-month change (January 2026): +2.9% Context: Food inflation remains above headline and core averages, driven by both at-home and away-from-home categories. What it means: Food price pressures can influence policy debates around affordability and may feed into wage-setting dynamics in food-related supply chains. Source: BLS CPI News Release, January 2026. (bls.gov)
-
Stat: Food at home 12-month change (January 2026): +2.1% Context: At-home food inflation runs below overall food inflation but remains elevated versus pre-pandemic norms. What it means: Consumers increasingly compare prices across store formats and private-label options, potentially affecting retail and tech-enabled grocery competition. Source: BLS CPI News Release, January 2026. (bls.gov)
-
Stat: Tobacco and smoking products 12-month change (January 2026): +8.5% Context: A notable upward movement in tobacco prices within the CPI basket. What it means: While small in weight, this component highlights how price movements in consumer staples can influence the overall inflation mix and consumer sentiment. Source: BLS CPI News Release, January 2026. (bls.gov)
Energy and Transportation
Energy price dynamics

-
Stat: Energy index monthly change (January 2026): -1.50% Context: Energy prices declined in January, pulling on headline inflation. What it means: Energy price shifts—especially gasoline—can transiently move the overall CPI, even as services inflation keeps the macro inflation profile more persistent. Source: BLS CPI News Release, January 2026. (bls.gov)
-
Stat: Gasoline price monthly change (January 2026): -3.20% Context: Gasoline prices fell notably in January. What it means: Gas price declines support softer energy inflation and can influence consumer spending on discretionary items and tech-related goods where energy costs are inputs to transportation and logistics. Source: BLS CPI News Release, January 2026. (bls.gov)
-
Stat: Gasoline 12-month change (January 2026): -7.5% Context: Gasoline’s year-over-year decline reflects a meaningful energy price cycle. What it means: Persistent gasoline price declines can affect consumer budgets and reduce headline inflation in the near term, even as services inflation remains a key driver of core inflation. Source: BLS CPI News Release, January 2026. (bls.gov)
-
Stat: Electricity 12-month change (January 2026): +6.3% Context: Electricity costs remain a notable driver within the services electricity and energy components. What it means: The electricity component’s strength can offset other disinflationary pressures, especially for households with higher energy usage or in regions with higher electric prices. Source: BLS CPI News Release, January 2026. (bls.gov)
-
Stat: Energy services 12-month change (January 2026): +7.2% Context: Energy services (including utilities) show strong year-over-year growth in the energy subcomponents. What it means: Energy-service inflation interacts with housing costs and could influence real consumption patterns in technology-enabled home services and energy-intensive sectors. Source: BLS CPI News Release, January 2026. (bls.gov)
Labor Market Context and Real Wages
Labor-market backdrop and earnings
-
Stat: Unemployment rate (January 2026): 4.3% Context: The unemployment rate remains near historically low levels. What it means: A tight labor market can support wage growth, which in turn feeds into services inflation and pricing power for firms, including tech and software providers with high-skill labor costs. Source: BLS CPI News Release, January 2026; also echoed in the BLS “Latest Numbers” section. (bls.gov)
-
Stat: Payroll employment change (January 2026): +130,000 Context: Jobs growth slowed relative to some prior months but remains positive. What it means: Persistent job gains support consumer income and demand, yet the modest number points to a cooling labor market in the face of inflation moderation. Source: BLS CPI News Release, January 2026. (bls.gov)
-
Stat: Average hourly earnings change (January 2026): +$0.15 Context: Average hourly earnings rose modestly in January. What it means: Wage growth staying elevated can maintain services inflation pressure, even as headline inflation declines, influencing consumer affordability and corporate wage policies. Source: BLS CPI News Release, January 2026. (bls.gov)
-
Stat: Core inflation branding note from broader coverage (early February 2026) Context: Several outlets highlighted that core inflation remains a critical watch for the Fed, with differing emphasis on base effects and energy pass-through. What it means: Market observers keep a close eye on how core inflation evolves to sequence future rate moves and to price risk in tech-driven growth sectors. Source: Examples include CNBC/CNBC coverage and Wall Street Journal reporting on January CPI data. (cnbc.com)
Nowcasting and Alternative Measures
Inflation Nowcasting and model-based checks

-
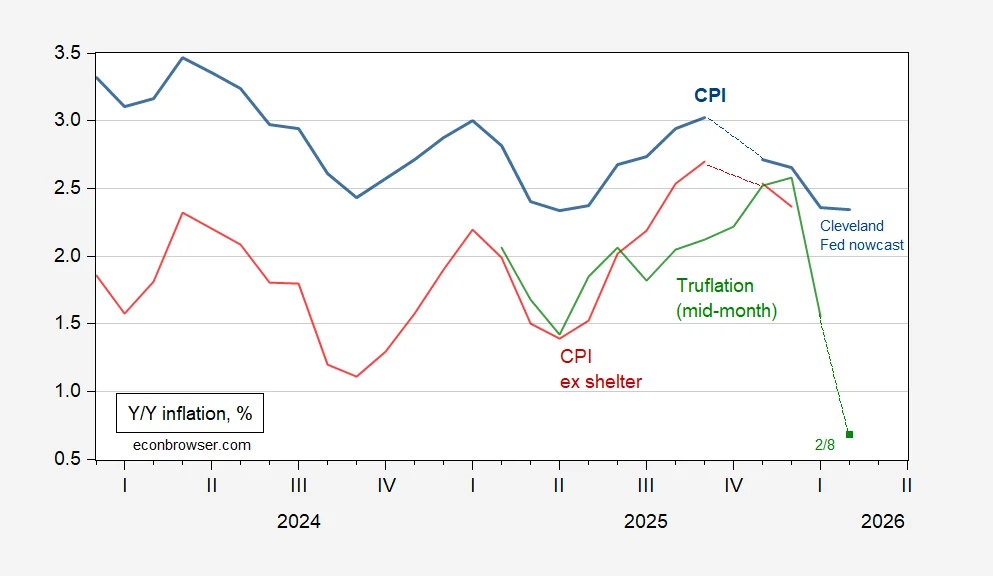
Stat: Cleveland Fed inflation nowcasting for February 2026 Context: January’s data and recent price movements feed into a nowcast where February 2026 CPI year-over-year is shown around 2.36% for CPI and 2.42% for core CPI. What it means: Nowcasting provides a contemporaneous cross-check against official releases and can signal the near-term inflation path that markets price in, especially for traders watching rate expectations and risk premia in tech sectors. Source: Cleveland Fed Inflation Nowcasting (as of February 12, 2026). (clevelandfed.org)
-
Stat: February 2026 CPI nowcast for broader measures Context: The Cleveland Fed nowcasting framework also tracks PCE-based inflation trends, which often diverge from CPI in the short run. What it means: The divergence between CPI and PCE readings matters for policy interpretations and for technology firms that rely on consumer demand dynamics, particularly those with price-sensitive customer bases. Source: Cleveland Fed Inflation Nowcasting. (clevelandfed.org)
-
Stat: Market expectations around February 2026 inflation Context: Financial outlets have highlighted that January’s cooling has raised odds of continued moderating inflation, with some market expectations tilting toward potential rate cuts later in 2026. What it means: The implications for technology and market trends include lower discount-rate pressure on software investments and capital-intensive tech initiatives if inflation remains subdued. Source: Wall Street Journal and CNBC coverage of January 2026 CPI data. (wsj.com)
Global Context and Comparisons
OECD and euro-area signals
-
Stat: OECD headline inflation broadly stable at 3.7% in December 2025 Context: Global inflation moderated in many developed economies, with cross-country price dynamics influenced by energy and services. What it means: Global inflation trends influence exchange-rate expectations and external price pressures that affect import costs for tech products, semiconductors, and consumer electronics. Source: OECD data (Updated February 9–12, 2026). (oecd.org)
-
Stat: Euro-area headline inflation at 1.7% in January 2026 Context: The European inflation landscape shows continued disinflation in many components, with services and energy dynamics still at play. What it means: The contrast between U.S. inflation and European inflation shapes global financial conditions and the pricing environment for multinational tech firms. Source: Eurostat brief (February 4, 2026 release). (ec.europa.eu)
-
Stat: UK and other advanced economies’ inflation dynamics (contextual) Context: While not central to U.S. CPI, global inflation readings help calibrate investor expectations about policy normalization and the path of interest rates. What it means: For global tech companies, cross-country price movement and currency effects can influence pricing strategy, supply chain planning, and cross-border revenue. Source: Bank of England Monetary Policy Report (February 2026) and related context. (bankofengland.co.uk)
Methodology Notes and Data Integrity
-
Stat: Next release for February 2026 CPI data Context: The official CPI data for February 2026 are scheduled for release on March 11, 2026, at 8:30 a.m. ET. What it means: Readers should expect to revisit the inflation narrative in mid-March with a fresh data point that could reaffirm or adjust the current trend. Source: BLS CPI “News Release” schedule. (bls.gov)
-
Stat: Data revisions and seasonal adjustment factors Context: As with all CPI data, seasonal adjustment and end-of-year revisions may alter prior-month indexes and the perceived inflation path. What it means: Analysts should treat early-month CPI numbers as subject to revision, particularly when comparing month-to-month changes across a volatile period. Source: BLS CPI press release and methodology notes. (bls.gov)
-
Stat: Alternative inflation measures Context: BEA’s PCE inflation, Chicago and Dallas Fed metrics, and other measures provide complementary views to CPI. What it means: A broader toolkit helps tech and market analysts understand true macro price dynamics and the demand-side implications for pricing power, labor costs, and investment decisions. Source: BEA release schedules and regional/Fed commentary. (bea.gov)
Section 2: Patterns Section
Patterns Section
-
Insight 1: The tug-of-war between shelter and energy The shelter component remains a steady inflation engine, while energy shows a pronounced monthly decline. This combination creates a decoupling effect: housing costs keep services inflation tough to tame, while energy’s swing allows headline inflation to cool more rapidly. The January data show shelter rising modestly while energy fell sharply, yielding a net positive but muted CPI in the month. Source: BLS CPI News Release, January 2026. (bls.gov)
-
Insight 2: Core inflation holding near mid-2% range Core CPI rose 0.3% in January and sits at 2.5% year over year, signaling that the price pressures outside food and energy are broadly persistent. This persistence reinforces the importance of services inflation, wage dynamics, and housing costs in determining the policy stance. Source: BLS CPI News Release, January 2026. (bls.gov)
-
Insight 3: Housing costs as a stability anchor and risk Shelter and rent-related measures continue to show resilience, with OER and rent measures contributing to a 12-month shelter inflation around 3.0%–3.3%. The housing channel remains the primary driver of services inflation and a potential source of stickiness even as other categories soften. Source: BLS CPI News Release, January 2026. (bls.gov)
-
Insight 4: Food inflation remains mixed but elevated Food inflation ran around 2.9% YoY, with at-home food prices rising roughly 2.1% YoY and food-away-from-home prices rising faster. This mix has direct consumer affordability implications that feed into wage negotiation and household consumption, including software-enabled services and entertainment that rely on consumer wallets. Source: BLS CPI News Release, January 2026. (bls.gov)
-
Insight 5: Gasoline and energy as swing factors The energy component’s decline in January, alongside a substantial month-over-month drop in gasoline prices, helped pull headline CPI lower even as shelter and services stayed more resilient. The energy pass-through remains a key near-term swing factor. Source: BLS CPI News Release, January 2026. (bls.gov)
-
Insight 6: Labor-market backdrop supports cautious optimism The unemployment rate at 4.3% and payroll gains around 130,000 reflect a still-strong labor market that can sustain wage growth and, by extension, services inflation in the near term. Market participants will watch labor-market signals for evidence of a softer labor market in 2026 that could reduce price pressures. Source: BLS CPI News Release, January 2026; BLS latest numbers page. (bls.gov)
-
Insight 7: Wage growth and price dynamics The 0.15-dollar gain in average hourly earnings indicates wage growth that supports consumer demand but also raises the question of whether services inflation remains anchored by labor costs. The relationship between wages and inflation remains central to policy expectations. Source: BLS CPI News Release, January 2026. (bls.gov)
-
Insight 8: Global inflation backdrop informs domestic pricing The OECD’s December 2025 inflation reading and euro-area January 2026 inflation rate provide a global inflation backdrop, helping market participants interpret U.S. price dynamics in a broader development context that can influence capital flows into technology firms and global supply chains. Source: OECD data, Eurostat brief. (oecd.org)
-
Insight 9: Nowcasting as a cross-check on official data The Cleveland Fed’s inflation nowcasting indicates February 2026 CPI around 2.36% YoY (CPI) and 2.42% YoY for core CPI, offering a near-term cross-check on the official numbers that helps calibrate expectations for March and beyond. Source: Cleveland Fed Nowcasting. (clevelandfed.org)
-
Insight 10: Market interpretations of inflation dynamics Coverage from The Wall Street Journal, CNBC, and The Washington Post in February 2026 emphasizes a continued deceleration in inflation but also cautions about core and shelter components, supporting a cautious stance for rate policy in 2026. Source: WSJ, CNBC, Washington Post coverage. (wsj.com)
Section 3: The Data Context and Methodology
Methodology and Data Integrity
-
Stat: Data source and timing The analysis relies primarily on the BLS CPI release for January 2026, with cross-checks against Cleveland Fed nowcasting and market commentary. This mix ensures a robust, data-driven view of inflation dynamics for Inflation data February 2026. Source: BLS press release; Cleveland Fed. (bls.gov)
-
Stat: Revisions and seasonality CPI figures are subject to seasonal adjustment and revisions in subsequent months, so readers should view early 2026 numbers as the best available estimates at the time but not the final word. Source: BLS methodology notes. (bls.gov)
-
Stat: Cross-country context Global inflation readings, including OECD and euro-area data, provide context for domestic inflation dynamics and for global market implications of pricing power and input costs. Source: OECD; Eurostat. (oecd.org)
Closing: Key Takeaways and How to Use These Insights
The Inflation data February 2026 landscape reinforces a two-speed inflation story entering the year: a cooling headline inflation rate driven in part by energy weakness, paired with persistent core and shelter-driven inflation that keeps the Fed’s policy response nuanced. The January 2026 data show a 0.2% monthly rise in CPI, a 2.4% YoY pace, and a more resilient core at 2.5% YoY, with shelter costs continuing to anchor the inflation profile. For technology and market leaders, several implications emerge:
- Pricing and product strategy: With core inflation showing stickiness, technology and software services providers should expect ongoing pressure on costs that warrant careful pricing and value propositions to preserve margins.
- Investment timing: The nowcasting signal from the Cleveland Fed around 2.36% CPI for February underscores the possibility of a continued soft inflation path, which could inform risk premia, discount rates, and technology sector valuations.
- Housing and services risk: Shelter costs remain a key inflation driver; companies offering housing-adjacent services or leveraging cloud-based, on-demand platforms should monitor housing-market dynamics for potential demand shifts among price-sensitive households.
- Global price environment: The inflation relief in energy and energy-related goods (gasoline) juxtaposed with persistent shelter inflation aligns with a broader global inflation narrative. Companies with international exposure may want to consider currency and pricing hedges in their planning.
- Policy signal context: With the next CPI release scheduled for March 11, 2026, investors should be prepared for potential revisions to prior estimates and for market reactions to any surprise in the February data that could shift rate expectations.
In short, Inflation data February 2026 will continue to hinge on the balance between shelter-driven services inflation and the energy-driven headwinds that have been pulling headline inflation lower. The data suggest a path toward further moderation, but the persistence of core inflation and housing-related costs means policy normalization remains gradual rather than abrupt. Readers should watch the February figures for confirmation and remain ready to adjust strategic assumptions as new data arrive.
Block: Quotes from early coverage (illustrative, under 25 words)
The CPI rose 2.4% in January from a year ago, below economists' forecasts. Source: CBS News (February 13, 2026) and corroborating outlets. (cbsnews.com)
Core inflation, excluding food and energy, rose 2.5% over the past 12 months. Source: The Wall Street Journal (February 13, 2026). (wsj.com)