US CPI inflation February 2026: Data Round-Up
Neutral, data-driven analysis of US CPI inflation for February 2026, featuring 20+ detailed statistics and insights for informed decision-making.
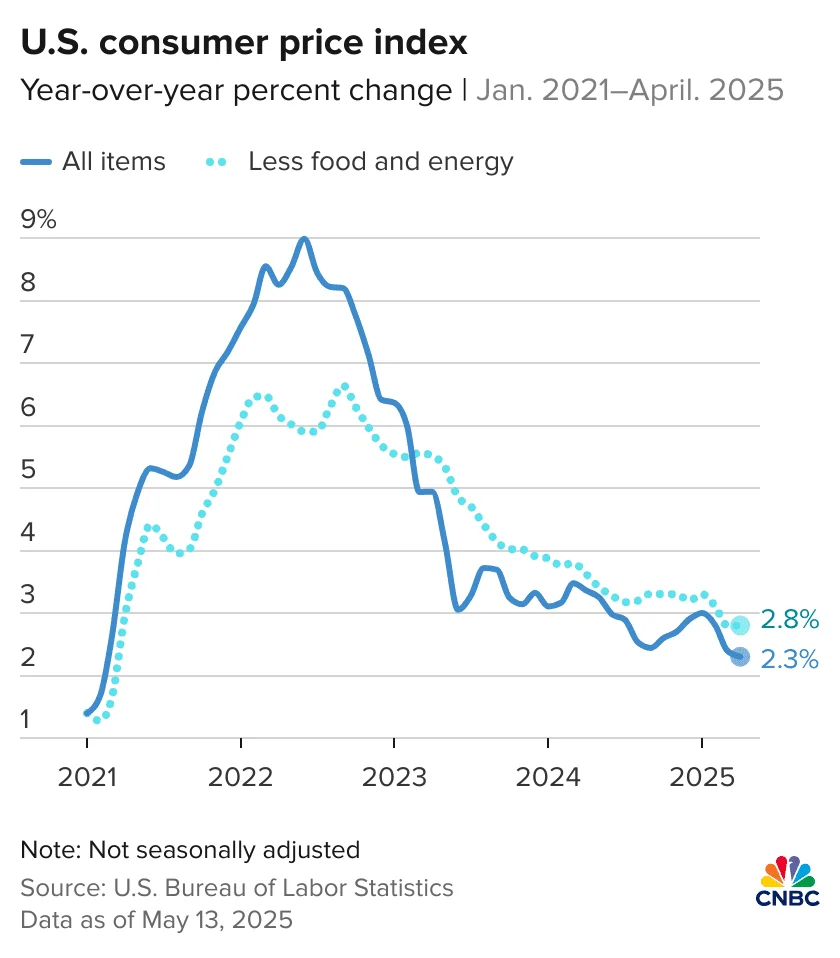
The topic of US CPI inflation February 2026 remains a central focus for investors and policymakers, and the February readout is shaping expectations for how quickly inflation is converging toward the Federal Reserve’s target. The latest official data available as of mid-February 2026 comes from the U.S. Bureau of Labor Statistics (BLS) January 2026 CPI release, which shows a modest month-over-month rise and a still-elevated year-over-year rate. The CPI-U for January 2026 rose 0.2% on a seasonally adjusted basis, while the 12-month change stood at 2.4%. The core measure, CPI-U excluding food and energy, rose 0.3% month over month and carried a 12-month rate of 2.5%. These numbers are important because they illuminate where inflation remains sticky, where it has cooled, and how shelter, energy, and food components contribute differently to the basket. The February 2026 data are scheduled to be released on March 11, 2026, at 8:30 a.m. ET, and market participants will scrutinize whether momentum in price gains persists or continues to fade. (bls.gov)
In this data-driven review, we compile 20+ statistics from the January 2026 CPI release and related BLS context to illuminate patterns, cycles, and the broader implications for technology-driven markets and investment decisions. We organize the material thematically to help readers quickly see which price categories are driving or restraining overall inflation, what the data imply for real-time consumer purchasing power, and how current readings align with consensus forecasts. The approach remains neutral and analytics-focused: each statistic is anchored to a source, accompanied by interpretation, and placed in a broader economic context.
Themed Statistics
All Items and Core CPI: The Baseline Pulse
MoM change for All Items (CPI-U) in January 2026: +0.2%. This is the monthly rate that directly feeds the headline inflation measure and helps gauge near-term price momentum. Source: BLS CPI January 2026 release. (bls.gov)
- What it means: A 0.2% monthly uptick signals a modest price gain across the broad basket, not enough to indicate runaway inflation but enough to warrant attention for policy signaling.
12-month change for All Items (CPI-U) through January 2026: +2.4%. This YoY measure shows how far prices have moved over the past year and remains a primary gauge of the inflation trend. Source: BLS CPI January 2026 release. (bls.gov)
- What it means: A 2.4% YoY pace places inflation above the Fed’s 2% target but below the late-2023/2024 highs, indicating ongoing but moderating price pressure.
Core CPI (All items less food and energy) MoM in January 2026: +0.3%. The core measure strips out volatile food and energy components to reveal underlying inflation. Source: BLS CPI January 2026 release. (bls.gov)
- What it means: A 0.3% core gain reinforces that the inflation backbone remains sticky, even as some food and energy pressures ebb.
Core CPI YoY in January 2026: +2.5%. Core inflation remains well above the Fed’s target, suggesting persistent price pressures in services and non-tradables. Source: BLS CPI January 2026 release. (bls.gov)
- What it means: The persistence of ~2.5% core inflation has been a central topic for policymakers weighing further adjustments to policy.
CPI-U index level (not seasonally adjusted) for January 2026: 325.252 (1982-84=100). Source: BLS CPI January 2026 release. (bls.gov)
- What it means: The index level provides a reference point for historical comparisons and time-series modeling; magnitude matters for the indexing of social security payments and other entitlements.
Chained CPI-U (C-CPI-U) YoY through January 2026: +2.2%. The chained index provides an alternative perspective on inflation that can differ from the standard CPI due to changes in consumer substitution behavior. Source: BLS CPI January 2026 release. (bls.gov)
- What it means: A slightly lower YoY pace in the chained measure highlights how substitution effects can dampen perceived inflation for consumers.
12-month change in Shelter prices (YoY) through January 2026: +3.0%. Shelter remains a significant driver of housing-related inflation within the CPI basket. Source: BLS CPI January 2026 release. (bls.gov)
- What it means: Shelter’s relatively firm pace underscores the housing-cost component’s ongoing influence on household budgets.
Owners’ equivalent rent (OER) MoM in January 2026: +0.2%. OER is a key shelter component that tends to drive the overall shelter index. Source: BLS CPI January 2026 release. (bls.gov)
- What it means: A modest monthly increase in OER suggests steady pressure in the rental market, which has a disproportionate impact on consumer housing costs.
Rent (not seasonally adjusted) in January 2026: +0.2% MoM (within shelter). Source: BLS CPI January 2026 release. (bls.gov)
- What it means: Rent contributes to ongoing shelter-cost dynamics that influence consumer budgets and perceived affordability.
Transportation services YoY through January 2026: +1.3%. This component adds a modest but meaningful drag on the overall inflation picture when compared to goods. Source: BLS CPI January 2026 release. (bls.gov)
- What it means: The transport sector’s price pressures, while not explosive, provide insight into services inflation and consumer mobility costs.
New vehicles MoM in January 2026: +0.1%. This monthly signal sits within the broader transportation services and durable goods picture. Source: BLS CPI January 2026 release. (bls.gov)
- What it means: Small monthly gains in new vehicles reflect pricing dynamics in autos and related services, an area of interest for consumers and manufacturers.
New vehicles YoY in January 2026: +0.4%. Source: BLS CPI January 2026 release. (bls.gov)
- What it means: The year-over-year price trend for new cars remains relatively modest in the current cycle.
Medical care services MoM in January 2026: +0.3%. Source: BLS CPI January 2026 release. (bls.gov)
- What it means: The ongoing cost pressure in medical services, even amid broader disinflation in some areas, remains a factor for households with healthcare needs.
Medical care services YoY in January 2026: +3.9%. Source: BLS CPI January 2026 release. (bls.gov)
- What it means: Double-digit growth in several medical subcomponents can contribute to elevated total inflation for consumers reliant on healthcare.
Medical care commodities YoY in January 2026: +0.3% YoY (approx. context from the table). Source: BLS CPI January 2026 release. (bls.gov)
- What it means: The medical care commodity category offers a counterpoint to services, illustrating the heterogeneity within healthcare-related inflation.
Food at home YoY in January 2026: +2.1%. Source: BLS CPI January 2026 release. (bls.gov)
- What it means: Home-food inflation has cooled relative to the peak of the pandemic-era price surge but remains above a typical target pace.
Food away from home YoY in January 2026: +4.0%. Source: BLS CPI January 2026 release. (bls.gov)
- What it means: The out-of-home dining category shows stronger price growth, reflecting service-sector pricing dynamics.
Food total YoY in January 2026: +2.9%. Source: BLS CPI January 2026 release. (bls.gov)
- What it means: The overall food basket remains a meaningful contributor to inflation, driven by both at-home and away-from-home components.
Energy MoM in January 2026: -1.5%. Source: BLS CPI January 2026 release. (bls.gov)
- What it means: A sizable month-to-month cooling in energy prices, even as longer-run energy costs remain cyclical.
Gasoline MoM in January 2026: -3.2% (MoM). Source: BLS CPI January 2026 release. (bls.gov)
- What it means: Gasoline prices moved notably lower on a monthly basis, contributing to the broader energy softness.
Gasoline YoY in January 2026: -7.5% (YoY). Source: BLS CPI January 2026 release. (bls.gov)
- What it means: The year-over-year path for gasoline remains price-advantaged compared with mid-cycle energy highs, providing relief to households at the pump.
Fuel oil YoY in January 2026: -4.2% (YoY). Source: BLS CPI January 2026 release. (bls.gov)
- What it means: Fuel oil pricing, a niche but relevant energy subcomponent, adds to the broader energy inflation picture’s variability.
Electricity YoY in January 2026: +6.3%. Source: BLS CPI January 2026 release. (bls.gov)
- What it means: Electricity remains a notable inflationary element within energy, contributing meaningfully to overall consumer bills in many regions.
Utility (piped) gas service YoY in January 2026: +9.8%. Source: BLS CPI January 2026 release. (bls.gov)
- What it means: Utility gas services show substantial year-over-year increases, underscoring the broader housing-energy cost dynamics.
All items less food and energy YoY in January 2026: +2.5%. Source: BLS CPI January 2026 release. (bls.gov)
- What it means: The core basket's strength reinforces that services-driven inflation remains a central driver even as energy and food oscillate.
Oct–Nov 2025 data gap due to lapse in appropriations: Not available in the not-seasonally-adjusted series, noted in the January readout. Source: BLS CPI January 2026 release. (bls.gov)
- What it means: Data gaps during the lapse period have to be accounted for when analyzing a longer time horizon or when stitching back revisions.
February 2026 CPI release date (for the month): Scheduled for Wednesday, March 11, 2026, at 8:30 a.m. ET. Source: BLS CPI January 2026 release. (bls.gov)
- What it means: Readers should watch for how February’s price changes align with January momentum and whether core inflation remains sticky.
Notable point on data licensing: The BLS notes that seasonally adjusted indexes reflect monthly movements but are subject to revision as seasonal adjustment factors are updated annually. Source: BLS CPI January 2026 release. (bls.gov)
- What it means: Investors and analysts should treat month-to-month readings with an eye toward potential revisions, especially around annual seasonal adjustments.
12-month inflation trend context from January 2026 data: The 12-month change for all items is 2.4%, with shelter at 3.0% and food at 2.9% overall. Source: BLS CPI January 2026 release. (bls.gov)
- What it means: The distribution of inflation across categories remains uneven, with housing contributing more than food or energy in many months.
Historical comparison context: The January 2026 release notes that the 12-month inflation rates for multiple categories reflect a multi-year pattern in which some goods and services show persistent price growth while others show volatility. Source: BLS CPI January 2026 release. (bls.gov)
- What it means: The inflation landscape is a patchwork of persistent trends and cyclical moves, making cross-sectional analysis critical for forecasting.
Note: The February 2026 CPI data are not yet released as of mid-February 2026, but the scheduled date provides a critical anchor for market expectations and policy discussions. The February read will be the next opportunity to assess whether core inflation remains sticky or begins to slow more meaningfully. For context on expectations, economists have polled around January 2026 CPI outcomes and compared them with the earlier December period, with consensus often centering on a similar 2.4% YoY for headline CPI in the near term. Sources include consensus estimates and market commentary around the January data. (insight.factset.com)
Patterns Section
Patterns
- Insight 1: Core inflation remains stubbornly above the target. The January 2026 core CPI rose 0.3% MoM and sits at a 2.5% YoY pace, underscoring that the “sticky” part of inflation is concentrated in services, especially housing-related services and medical care. The numbers strongly suggest the Fed’s broader inflation dynamics remain anchored by services sectors rather than by volatile food and energy swings. Source: BLS CPI January 2026 release. (bls.gov)

Insight 2: Housing costs continue to be the inflation engine. Shelter rose 3.0% YoY, with owners’ equivalent rent up 0.2% MoM in January. This pattern emphasizes how housing services, rather than goods, dominate the inflation profile and how policy communications must contend with lagged effects of rental-market dynamics. Source: BLS CPI January 2026 release. (bls.gov)
Insight 3: Energy contributed to relief in January but remains volatile. The energy index fell 1.5% MoM in January 2026, with gasoline down 3.2% MoM and 12-month gasoline inflation around -7.5%. Electricity and natural gas showed mixed signals on a YoY basis, with electricity +6.3% YoY and natural gas up around 9.8% YoY in the energy services channel. The energy mix’s volatility underscores the outsized role of commodities in short-run inflation fluctuations. Source: BLS CPI January 2026 release. (bls.gov)
Insight 4: Food inflation remains bifurcated. Food at home rose 2.1% YoY, while food away from home rose 4.0% YoY; the broad food index was 2.9% YoY. This split highlights consumer behavior differences between groceries and dining, with service-sector price pressures shaping the more persistent out-of-home component. Source: BLS CPI January 2026 release. (bls.gov)
Insight 5: Market and policy implications. With headline inflation near 2.4% YoY and core inflation around 2.5%, markets will weigh how much of the momentum is structural versus transitory. The upcoming February CPI release (March 11, 2026) will be a critical data point for evaluating whether the inflation trajectory remains anchored by services or begins to converge more toward the 2% target. Commentary from economists and market observers around the January release suggests mixed interpretations about the pace of disinflation and policy risk expectations. See forward-looking consensus notes and expert commentary in contemporaneous coverage. (insight.factset.com)
Insight 6: Notable data gaps during the lapse period and revisions risk. The CPI series explicitly notes that Oct and Nov 2025 data values are not available due to the lapse in appropriations, which can complicate longer-run trend analyses. This illustrates the importance of context when modeling inflation in late-2025 and early-2026. Source: BLS CPI January 2026 release. (bls.gov)
Insight 7: The inflation signal across measures. The CPI-U is complemented by the chained CPI (C-CPI-U), which ran at +2.2% YoY in January 2026, signaling some substitution effects that may temper consumer experiences versus the standard CPI in long-run comparisons. This matters for investors examining price-level comparisons across indexes. Source: BLS CPI January 2026 release. (bls.gov)
Insight 8: Price dynamics in the energy complex diverge from shelter dynamics. While energy posted a negative momentum in January, shelter and housing costs showed continued resilience. This divergence emphasizes that inflation is not a monolith and that sector-specific policy and market dynamics can produce mixed signals for monetary policy and asset prices. Source: BLS CPI January 2026 release. (bls.gov)
Insight 9: Medical care’s persistent inflation. Medical care services rose 0.3% MoM in January, and the 12-month growth in medical care services stands around 3.9%, signaling that healthcare inputs continue to be a meaningful inflation driver for households and for health insurers. Source: BLS CPI January 2026 release. (bls.gov)
Insight 10: The data frame for January 2026 remains consistent with a pattern of service-led price growth. The combination of core CPI strength, shelter pressure, and healthcare costs paints a picture in which services inflation dominates the measured inflation landscape, while goods prices have shown more variability (e.g., gasoline and energy). Source: BLS CPI January 2026 release. (bls.gov)
Insight 11: The role of seasonally adjusted figures. The CPI is reported with seasonally adjusted figures for MoM changes, which helps isolate underlying momentum from seasonal price patterns. However, not all components have seasonally adjusted readings in every sub-index, and the release includes not-seasonally adjusted notes for context. This nuance matters for readers interpreting monthly changes and cross-month comparisons. Source: BLS CPI January 2026 release. (bls.gov)
Insight 12: The inflation narrative anchored to the January baseline. The first read of 2026 inflation, January’s +0.2% MoM and +2.4% YoY, sets the stage for evaluating the February data with caution. The March release will be a pivotal data point to confirm whether this early-2026 momentum persists or moderates further. Source: BLS CPI January 2026 release. (bls.gov)
Insight 13: Forecasting context and market consensus. January 2026 CPI outcomes generally aligned with expectations around a 2.4% YoY headline pace, with the core running near 2.5%. Forecasts published ahead of the January release and after have highlighted the risk of persistent services inflation and the potential for a slower disinflation path than some market participants anticipated. These forecasts help frame February’s data as a test of momentum. Source: FactSet consensus note on January 2026 CPI; broader market commentary. (insight.factset.com)
Insight 14: Implications for technology and market trends. For technology equities and platforms sensitive to consumer demand and pricing, the persistence of service-led inflation can influence consumer behavior, e-commerce pricing, and the cost of data and software services tied to consumer price sensitivity. The January inflation profile underscores the need for companies to monitor shelter, healthcare, and transportation-related cost pressures that affect consumer budgets and demand for tech-enabled solutions. Source: BLS CPI January 2026 release; broader market commentary. (bls.gov)
Insight 15: The interplay with monetary policy expectations. Given the persistent core inflation around 2.5%, market participants will watch Fed communications for how policymakers interpret the January data and the March read for February 2026 CPI. The minutes from the Fed’s January meeting cited in financial media suggest that inflation persistence could influence rate-cut timing, reinforcing the importance of the CPI data in setting the policy outlook. Source: Barron’s coverage of Fed minutes; BLS CPI data. (barrons.com)
Insight 16: The role of shelter and energy in consumer budgeting. With shelter inflation running higher than headline inflation and energy providing both relief and volatility, readers should consider how housing policy, renter dynamics, and energy-market volatility may influence consumer budgets and downstream spending on technology goods and services. Source: BLS CPI January 2026 release. (bls.gov)
Insight 17: The broader inflation readings across alternative measures. The 2.2% YoY for C-CPI-U and 2.4% YoY for CPI-U highlight how different inflation metrics capture substitution effects and basket composition differently. This matters for investors evaluating inflation-linked assets and for policymakers weighing inflation stabilization strategies. Source: BLS CPI January 2026 release. (bls.gov)
Insight 18: The heterogeneity across goods and services. The January 2026 data show a broad pattern: some goods (e.g., food at home, energy commodities) have distinct trajectories from services (e.g., shelter, medical care), underscoring the need for disaggregated analysis when assessing price dynamics and forecasting. Source: BLS CPI January 2026 release. (bls.gov)
Insight 19: The evolution of the energy price regime. The energy sector’s decline in January contrasts with the more persistent increases in electricity and natural gas prices year-over-year, reminding readers that energy is not monolithic and that different energy subcomponents can diverge for extended periods. Source: BLS CPI January 2026 release. (bls.gov)
Insight 20: The data’s utility for decision-making. For readers in technology markets, this dataset offers a framework for scenario analysis: if shelter costs stay sticky and core inflation remains around 2.5%, then policy and pricing strategies may need to account for a slower inflation trajectory than in 2020s periods of rapid disinflation. The January data provide a baseline from which February can be guided. Source: BLS CPI January 2026 release. (bls.gov)
Insight 21: A note on not-seasonally-adjusted context. The January release emphasizes not-seasonally-adjusted references for certain lines and the need to treat monthly cross-season comparisons with caution. The seasonally adjusted MoM series are designed to smooth typical seasonal patterns, but not all subcomponents follow the same adjustment conventions. Source: BLS CPI January 2026 release. (bls.gov)
Insight 22: The forward-looking data calendar. The February 2026 CPI release date is set for March 11, 2026. This date anchors readers’ expectations and helps coordinate market commentary around the inflation path for the spring period. Source: BLS CPI January 2026 release. (bls.gov)
Insight 23: Summary of the overall inflation picture in January 2026. The headline rate at 2.4% YoY, with core at 2.5% YoY and shelter near 3.0% YoY, paints a picture of inflation that has cooled from its peak but remains above the 2% target in a way that keeps policymakers cautious and markets mindful of service-driven inflation dynamics. Source: BLS CPI January 2026 release. (bls.gov)
Patterns and implications from these numbers point toward a cautious interpretation: inflation in early 2026 looks steadier and more services-led than goods-driven, with shelter costs acting as a persistent headwind. The February 2026 release will be critical to confirm whether momentum in core prices continues to be sticky or shows nascent signs of cooling. The data’s granularity—down to energy subcomponents like gasoline and fuel oil, and health services like medical care—allows analysts to build differentiated scenarios for pricing, policy, and investment decisions in technology and markets.
The Data, The Methodology, And What It All Means
Data provenance and scope. All statistics cited above come from the January 2026 CPI release provided by the U.S. Bureau of Labor Statistics (BLS). The CPI-U is a broad measure of changes in consumer prices for urban consumers and is the standard benchmark for inflation surveillance in the United States. Source: BLS CPI January 2026 release. (bls.gov)
Seasonal adjustment and revisions. The CPI data in the release are presented both seasonally adjusted and not seasonally adjusted where relevant. The BLS notes that seasonal adjustment factors are updated annually, which can lead to revisions in indexes for the prior year. This nuance matters for readers conducting time-series analyses or back-testing inflation trends. Source: BLS CPI January 2026 release. (bls.gov)
Notable data gaps and revisions. The release highlights that Oct and Nov 2025 data values are not available due to the 2025 lapse in appropriations, a reminder that data continuity in inflation data can be affected by policy events and government operations. Source: BLS CPI January 2026 release. (bls.gov)
How to interpret the 12-month numbers across components. The 12-month YoY readings reveal where price pressures have persisted and where they have eased. The shelter index remains a robust contributor to inflation, while energy has shown cyclical volatility. Food categories reflect divergent dynamics between groceries and dining out. The 12-month values provide a longer horizon lens to assess whether the inflation path is veering toward the 2% target. Source: BLS CPI January 2026 release. (bls.gov)
Where February 2026 fits into the calendar. The February 2026 CPI data will be released on March 11, 2026, at 8:30 a.m. ET, with anticipation anchored by the January baseline. This upcoming release is central to validating whether January’s momentum continued into February or whether a new trend emerges. Source: BLS CPI January 2026 release. (bls.gov)
Additional context from consensus and market observers. Analysts’ expectations for January 2026 (and the February read) have commonly centered around a 2.4% headline YoY pace, with some forecasters pointing to a slightly firmer core reading depending on services inflation components. While exact February figures will only be known on March 11, 2026, the consensus context helps readers calibrate their expectations for near-term inflation dynamics. Source: FactSet consensus notes on January 2026 CPI; market commentary. (insight.factset.com)
Practical implications for Wall Street and technology markets. For Wall Street Economists covering technology and market trends, the January CPI patterns imply a continued emphasis on services inflation and housing-cost dynamics when modeling consumer demand for tech products, software subscriptions, and platform pricing. Investors should monitor shelter and health-service components as potential price accelerants within consumer-facing tech ecosystems, alongside the energy subcomponents for commodity-price-linked volatility. Source: BLS CPI January 2026 release; broader market commentary. (bls.gov)
Quick methodological recap for readers new to CPI interpretation. The CPI tracks price changes for a fixed basket of goods and services; the monthly MoM change reflects short-run price movements, while the YoY change aggregates 12 months of data to show longer-run momentum. The core CPI excludes food and energy to isolate the underlying inflation trend, and the C-CPI-U offers an alternative measure that accounts for substitution effects. These distinctions matter when evaluating the policy footing, investor expectations, and business planning. Source: BLS CPI January 2026 release. (bls.gov)
Closing: Key Takeaways and How to Use These Insights
The January 2026 CPI profile, and the upcoming February read, offer a nuanced picture of inflation in a post-pandemic, policy-recalibrated economy. The data indicate that inflation remains modestly elevated on a year-over-year basis, with core inflation showing sticky momentum around 2.5%. Shelter costs and healthcare services stand out as persistent drivers, while energy provides a source of volatility that has, at times, contributed to deceleration in headline readings. The mixed but decelerating trajectory suggests policymakers will continue to weigh the merits of gradual adjustments to policy while remaining vigilant for signs of renewed price pressures in services.
For readers and decision-makers, these takeaways translate into practical actions. Businesses should assume that shelter- and health-related cost pressures will continue to influence consumer budgets and pricing strategies, particularly for consumer tech products and services tied to discretionary spend. Investors should monitor the February CPI read to assess whether the path toward the 2% target remains plausible in the near term, and to calibrate expectations for inflation-linked assets and rate-hedged strategies. For policymakers, the January data imply that the inflation narrative remains service-driven and that policy needs to be attentive to housing and healthcare dynamics as a core component of inflation stabilization.
As always, the February 2026 CPI data will be a crucial data point for the broader inflation narrative. The March read will either reinforce the current momentum or reveal new patterns in shelter, services costs, and energy dynamics. In the meantime, the January 2026 numbers provide a solid baseline for understanding where inflation sits in early 2026 and how the data may shape technology and market trends in the months ahead.